Best prices for Official DELL PowerEdge R760 Servers.
Free Professional Consultation on server equipment.
Phone: +38 (067) 819-38-38 / E-mail: server@systemsolutions.com.ua
Online DELL Server Configurator
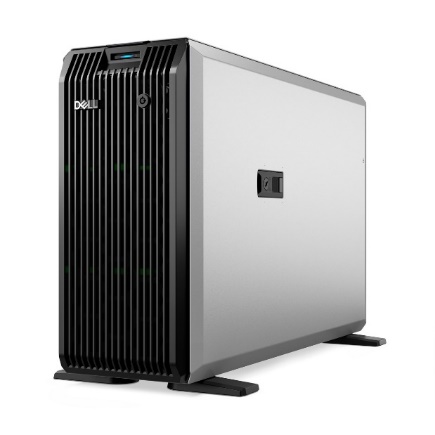
Introducing the Dell PowerEdge T360 and R360: Double the performance with Intel® Xeon® E-series processors.
The launch of the Dell PowerEdge T360 and Dell PowerEdge R360 servers is a significant addition to the Dell Technologies PowerEdge portfolio. These cost-effective 1-socket servers deliver powerful performance with the latest Intel® Xeon® E-series processors, GPU support, DDR5 memory, and PCIe Gen 5 I/O slots. They are designed to meet the growing computing needs of small and medium businesses (SMBs), remote offices/branch offices (ROBOs), and edge deployments.
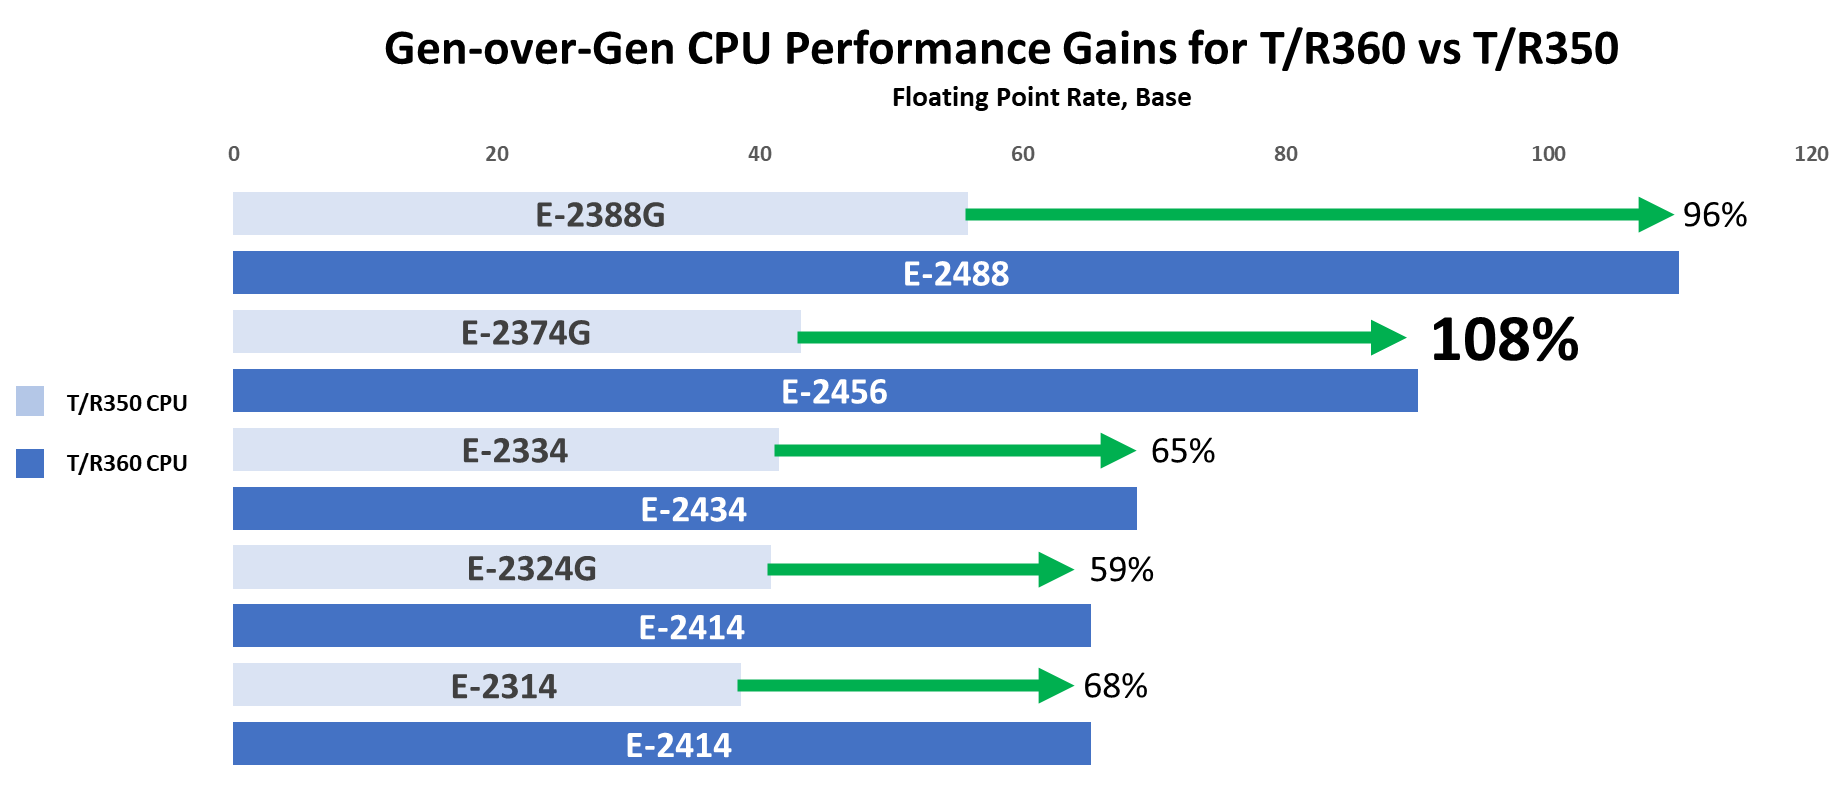
The T360 and R360 deliver up to 108% faster compute performance than the previous generation servers, giving customers up to 1.8x more performance for every dollar spent on the new E-series processors.
Adding and updating features
The table below lists the new features that are common to both the rack and tower form factors, as shown in the table below. Perhaps the most notable upgrades over the previous generation servers, the PowerEdge T350 and R350, are significantly faster processors, added support for entry-level GPUs, and nearly 1.4x faster memory.
- T360 and R360 key feature additions
|
Prior-Gen PowerEdge T350, R350 |
New PowerEdge T360, R360 |
|
|
CPU |
1x Intel Xeon E-2300 Processor, up to 8 cores |
1x Intel Xeon E-2400 Processor, up to 8 cores |
|
Memory |
4x UDDR4, up to 3200 MT/s DIMM speed |
4x UDDR5, up to 4400 MT/s DIMM speed |
|
Storage |
Hot Plug SATA BOSS S-2 |
Hot Plug NVMe BOSS N-1 |
|
GPU |
Not supported |
1 x NVIDIA A2 entry GPU |


Support for early GPUs
We are seeing a growing demand for video and audio computing, especially in retail, manufacturing, and logistics. To meet this demand, the PowerEdge T360 and R360 now support the NVIDIA A2 entry-level data center GPU, which accelerates these media-intensive workloads as well as emerging AI inference workloads. The A2 is a single-stack wide GPU with 16GB of graphics memory and a configurable thermal design power (TDP) of 40-60W. Learn more about the 20x inference acceleration and the capabilities of the A2 GPU here: A2 Tensor Core GPU | NVIDIA.
This update couldn’t be more timely for companies looking to scale and explore early AI use cases. IDC predicts that global spending on AI will reach $154 billion this year, with retail and banking leading the list of industries investing the most in AI. For example, a retailer can leverage the power of the A2 GPU and the latest processors to stream video from store aisles to manage inventory and analyze shopper behavior.
Product Differentiation - Rack or Tower Form Factor
The biggest difference between the T360 and R360 is their form factors. The T360 is a tower server that can be placed under a desk or even in a storage cabinet while maintaining office-friendly acoustics. The R360 is a traditional 1U rack-mount server. The table below details the differences in product specifications. In particular, the PowerEdge T360 has higher disk capacities for customers with intensive workloads or those who expect increased storage demand.
|
PowerEdge R360 |
PowerEdge T360 |
|
|
Storage |
Up to 4 x 3.5'' or 8 x 2.5'' SATA/SAS, max 64GB |
Up to 8 x 3.5'' or 8 x 2.5'' SATA/SAS, max 128G |
|
PCIe Slots |
2 x PCIe Gen 5 (QNS) or 2 x PCIe Gen4 |
3x PCIe Gen 4 + 1x PCIe Gen 5 |
|
Dimensions & Form Factor |
H x W x D: 1U x 17.08 in x 22.18 in 1U Rack Server |
H x W x D: 14.54 in x 6.88 in x 22.06 in 4.5U Tower Server |
CPU Performance Testing
The Dell Solutions Performance Analysis Lab (SPA) conducted SPEC CPU® 2017 testing on PowerEdge T360 and R360 servers powered by the latest Intel Xeon E-2400 series processors. SPEC CPU is an industry-standard test that measures both floating-point (FP) and integer computing performance. We compare the new results to the previous-generation PowerEdge T350 and R350 servers powered by Intel Xeon E-2300 processors.
The following generational comparisons represent common Intel processor configurations for R350/T350 and R360/T360 clients, respectively:
|
PowerEdge R350/T350 |
PowerEdge R360/T360 |
|
|
1 |
E-2388G, 8 cores, 3.2 GHz base frequency |
E-2488, 8 cores, 3.2 GHz base frequency |
|
2 |
E-2374G, 4 cores, 3.7 GHz base frequency |
E-2456, 6 cores, 3.3 GHz base frequency |
|
3 |
E-2334, 4 cores, 3.4 GHz base frequency |
E-2434, 4 cores, 3.4 GHz base frequency |
|
4 |
E-2324G, 4 cores, 3.1 GHz base frequency |
E-2414, 4 cores, 2.6 GHz base frequency |
|
5 |
E-2314, 4 cores, 2.8 GHz base frequency |

How can we help?
For more detailed information about the DELL PowerEdge R760 server with DDR5 4800 or the DELL PowerEdge R750 server with DDR4 3200, you can visit our SERVER SOLUTIONS website . To find out the cost of the server, click on the DELL Server Configurator link .
|
Processor |
Int Rate (Base) |
Int Rate (Peak) |
FP Rate (Base) |
FP Rate (Peak) |
|
|
1 |
E-2388G |
68.1 |
71.2 |
55.9 |
60.3 |
|
E-2488 |
95.1 |
99.2 |
110 |
110 |
|
|
% Increase |
39.65% |
39.33% |
96.78% |
82.42% |
|
|
2 |
E-2374G |
42.3 |
43.8 |
43.2 |
45.3 |
|
E-2456 |
68.3 |
71.1 |
90.1 |
90.3 |
|
|
% Increase |
61.47% |
62.33% |
108.56% |
99.34% |
|
|
3 |
E-2334 |
39.8 |
41.2 |
41.5 |
43.4 |
|
E-2434 |
50.8 |
52.6 |
68.7 |
68.9 |
|
|
% Increase |
27.64% |
27.67% |
65.54% |
58.76% |
|
|
4 |
E-2324G |
33 |
34 |
40.9 |
41.4 |
|
E-2414 |
39.7 |
41.1 |
65.2 |
65.7 |
|
|
% Increase |
20.30% |
20.88% |
59.41% |
58.70% |
|
|
5 |
E-2314 |
29.4 |
30.2 |
38.6 |
39 |
|
E-2414 |
39.7 |
41.1 |
65.2 |
65.7 |
|
|
% Increase |
35.03% |
36.09% |
68.91% |
68.46% |


